

Re/max Premier Inc., Brokerage
9100 Jane St
Concord, ON
L4K 0A4


Oakville, FA Falgarwood, L6H 2E9
$2,049,000$000000
Listed by Engel & Volkers Oakville.
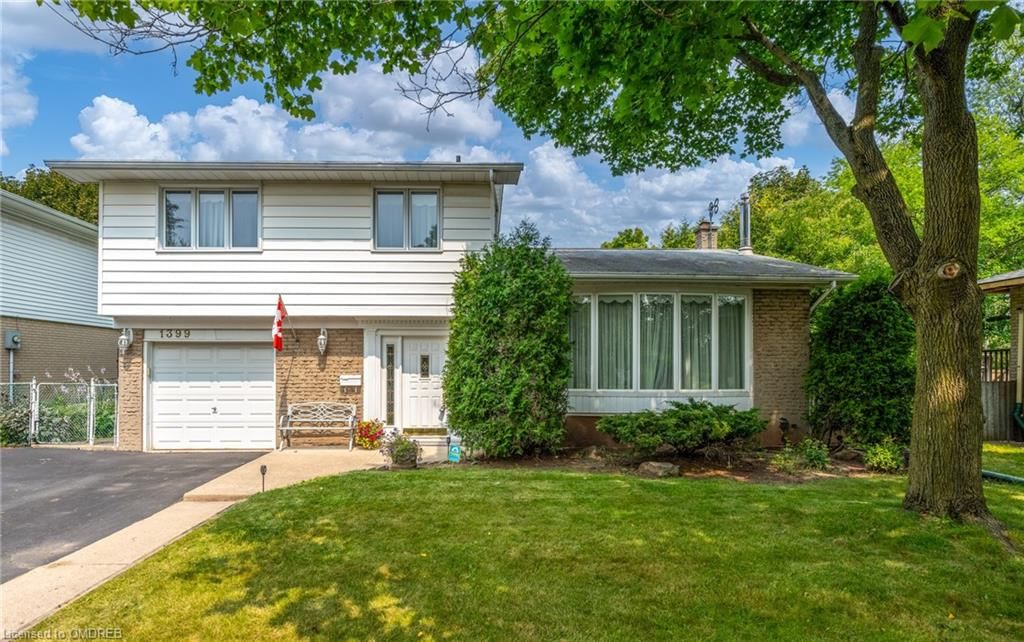
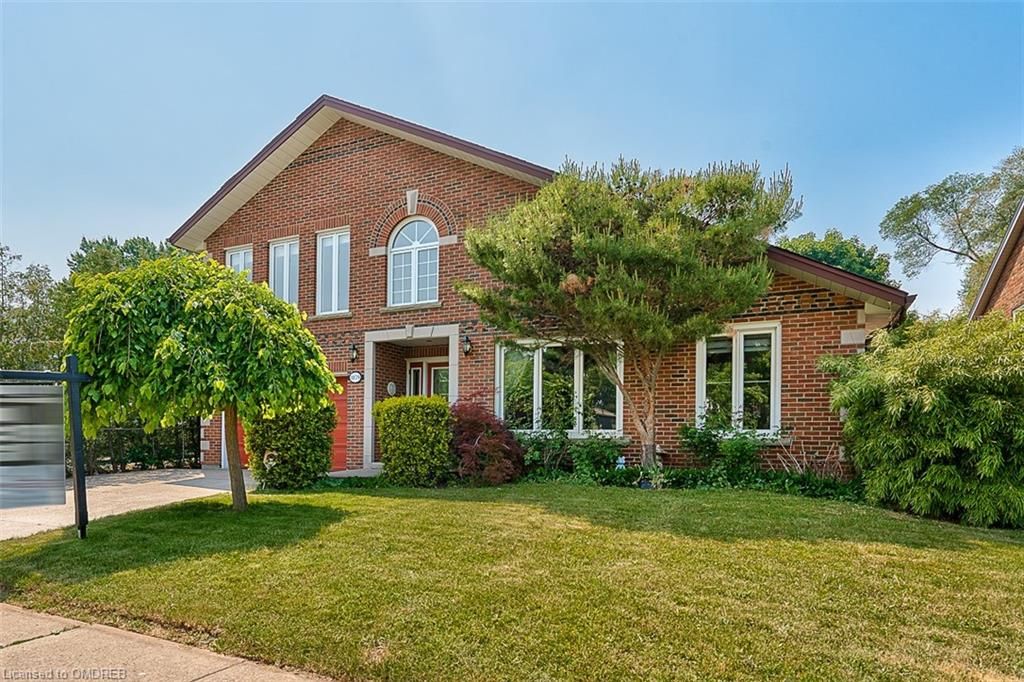
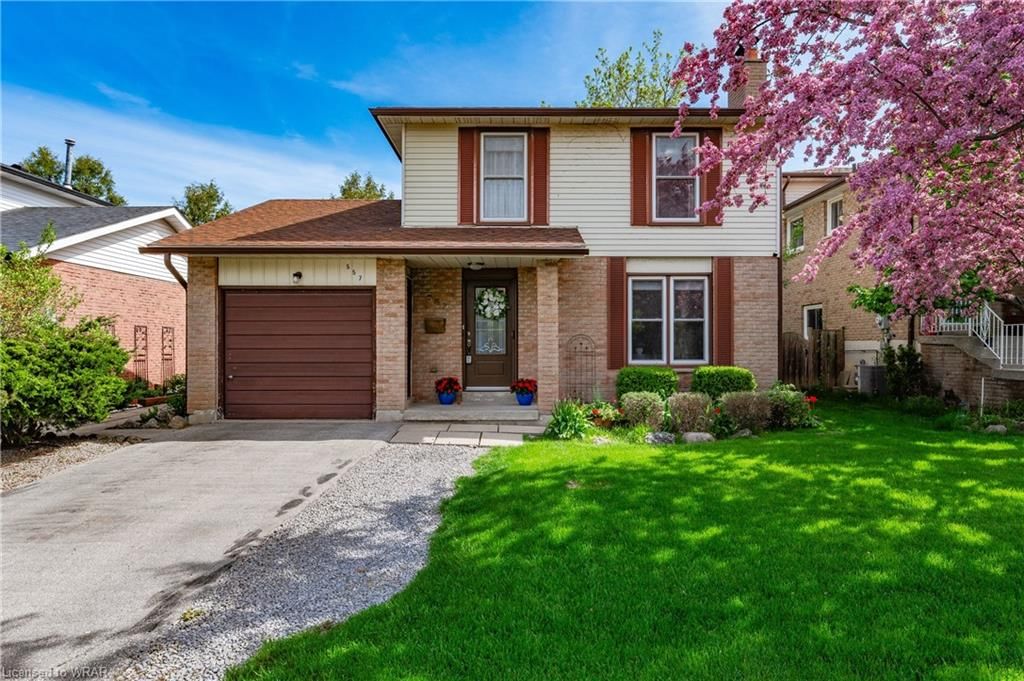
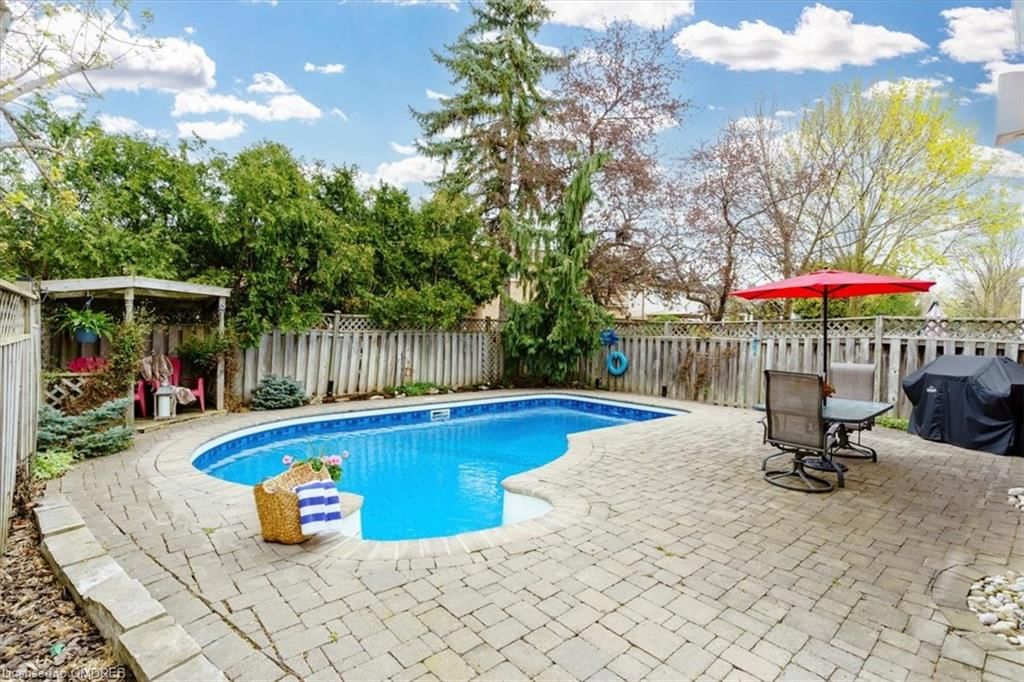
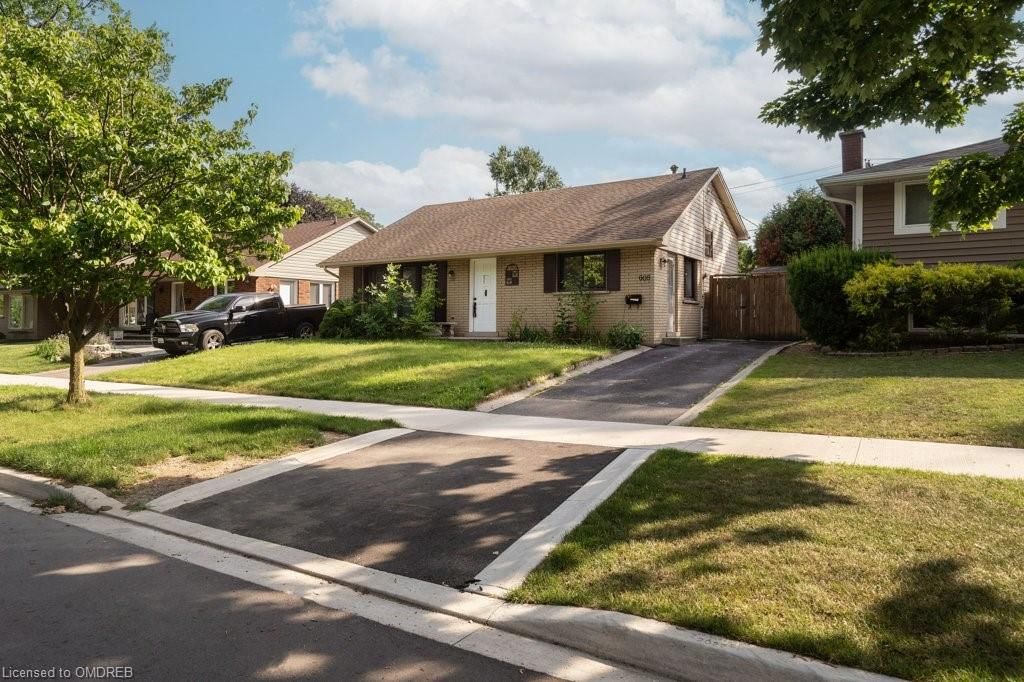
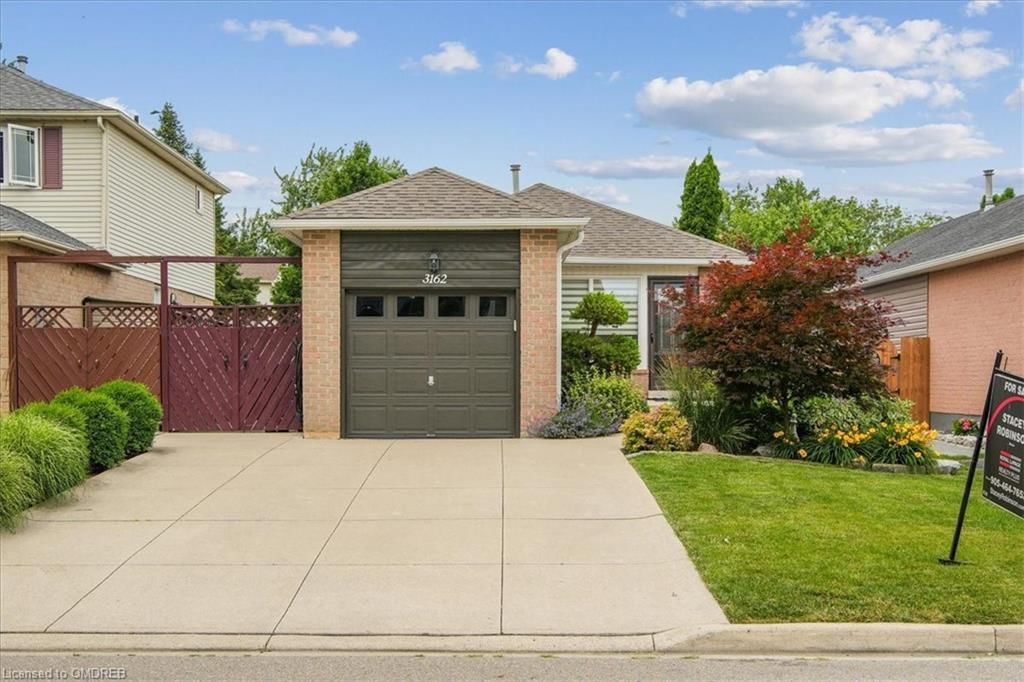
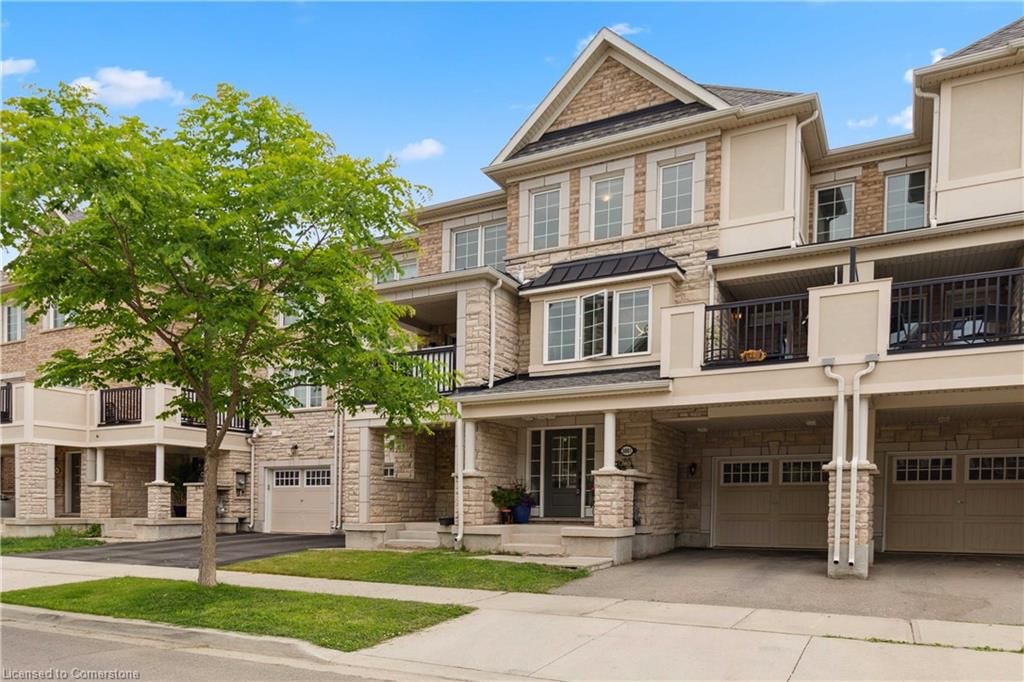
Stunning farmhouse inspired renovated home (2017) with custom addition in Falgarwood is a MUST SEE! This carpet free home boasts 7 1/4 wire brushed white oak floors, 9 foot ceilings , pot-lights throughout, spacious mud room w/BI cabinets, walk out to stone patio (2022), powder room w/shower. The open concept main floor features family room w/gas fireplace, custom eat-in kitchen w/large island, quartz countertops, brick backsplash w/exposed beam, built in kitchen bench, SS Appliances, beverage fridge. Primary bedroom addition soars vaulted ceilings, walk-in custom closet and additional B/I closet cabinets. The bathroom oasis is gorgeous w/soaker tub, exposed beams, heated floors, his/hers vanities, oversized glass shower. The 4th bedroom has been converted to a bright open concept office/homework station w/skylights giving lots of natural light. The walk-out to the deck (2022) is a multi level private entertainers backyard w/oversized shed and treehouse. Close to parks, Morrison Heights ravine, tennis courts, schools, highways, GO train. This walk score is 10+. Follow your Dream, Home.
Dishwasher,Dryer,Microwave,Range Hood,Refrigerator,Stove,Washer,Window Coverings,Ss Double Oven, Ss Dishwasher, Ss Fridge, Microwave, Bar Fridge In Kitchen/Primary Bedroom, All Elf’s, All Window Coverings, King Size Custom Built-In Bed And Side Tables, Shed.
Copyright 2024 Information Technology Systems Ontario, Inc. The information provided herein must only be used by consumers that have a bona fide interest in the purchase, sale, or lease of real estate and may not be used for any commercial purpose or any other purpose.
Mud Room
Eat-in Kitchen
Foyer
Living Room
Dining Room
Bedroom Primary
Den
Bedroom
Bedroom
Laundry
Recreation Room
Storage
The graph below compares the average list price and average sale price of homes in this neighborhood by month for the last 24 months. When average sale price is greater than average list price, this may suggest a buyer's market. When average sale price is lower than the average list price this may suggest a seller's market.
The graph below illustrates the average days on market for homes in this neighborhood. The yellow area may indicate a buyer's market, the green area may indicate a balanced market and the red area may indicate a seller's market.
Mississauga, Churchill Meadows, L5M 7T5